
Monthly Analytics Report
📅 Period: 08 January 2026 – 18 February 2026
🌐 Website: busl.ac.lk
📊 Source: Google Analytics (GA4) + Site Kit + Hostinger
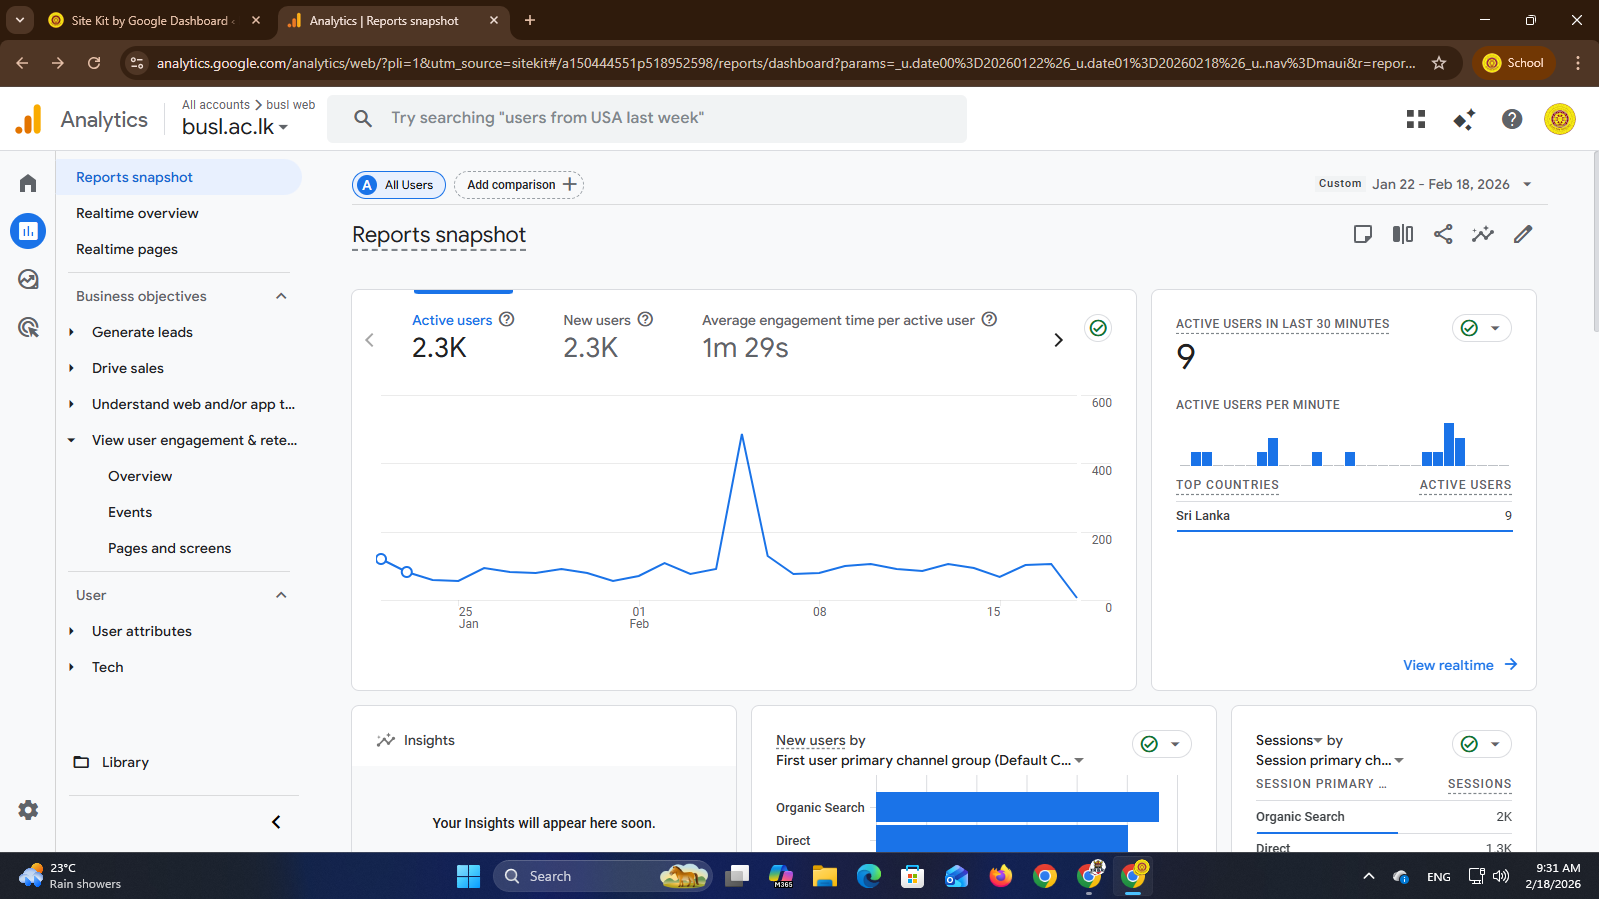
1️⃣ Overall Traffic Performance
👥 Users & Visitors
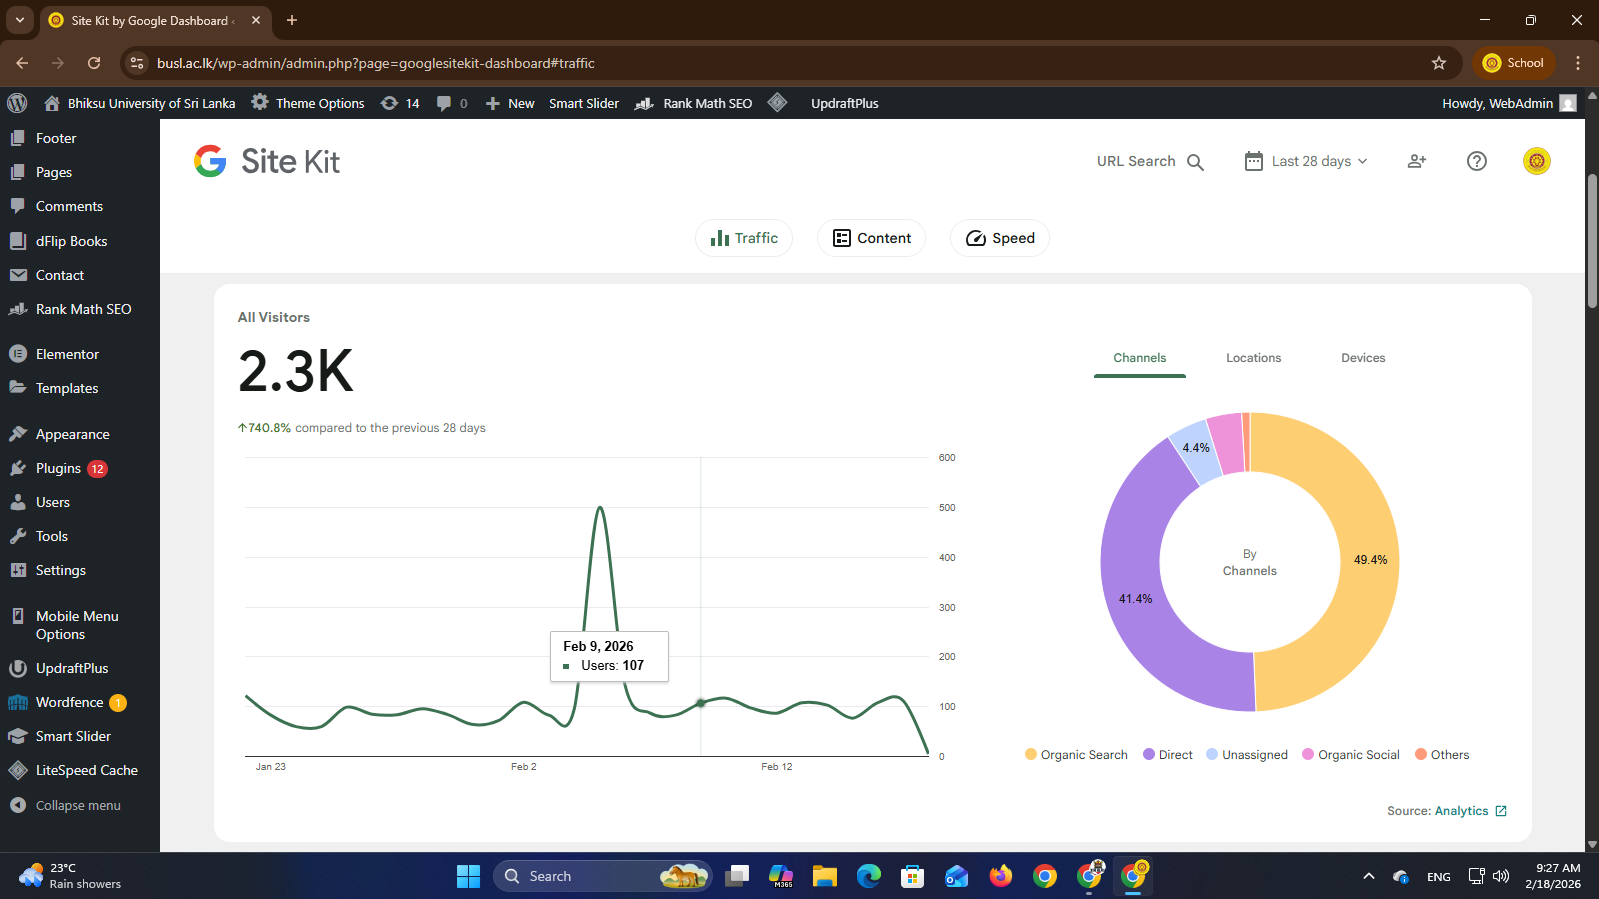
Active Users: 2.3K
New Users: 2.3K
Total Visitors (Site Kit): 2.3K
Growth: 🔼 +740.8% compared to previous period
👉 This is a very strong growth rate. Your visibility has significantly improved in this period.
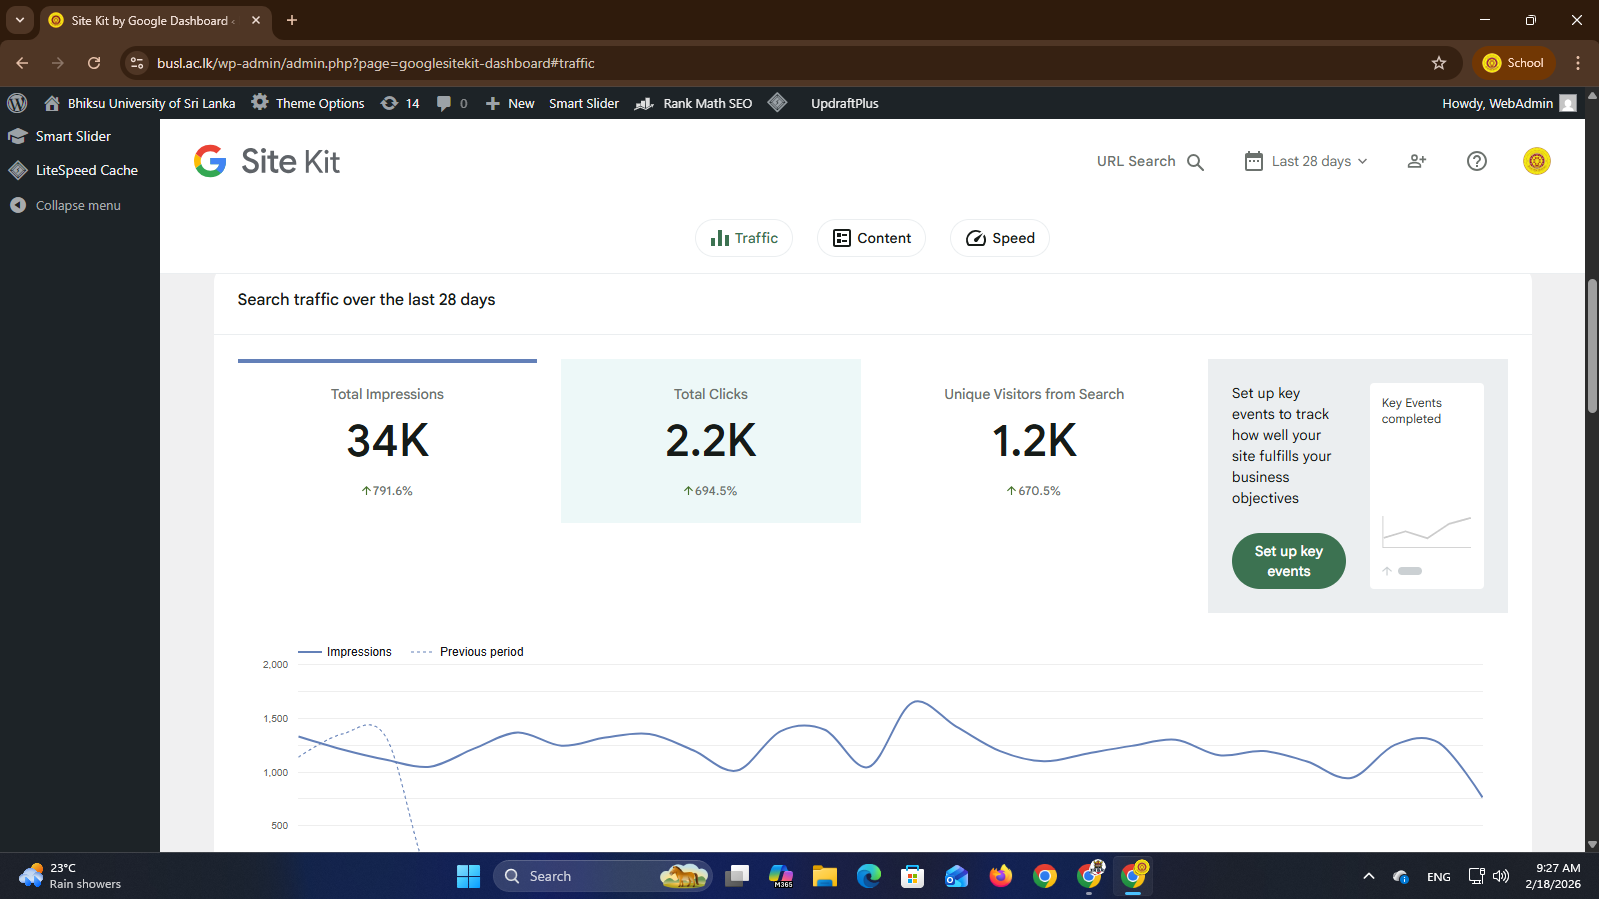
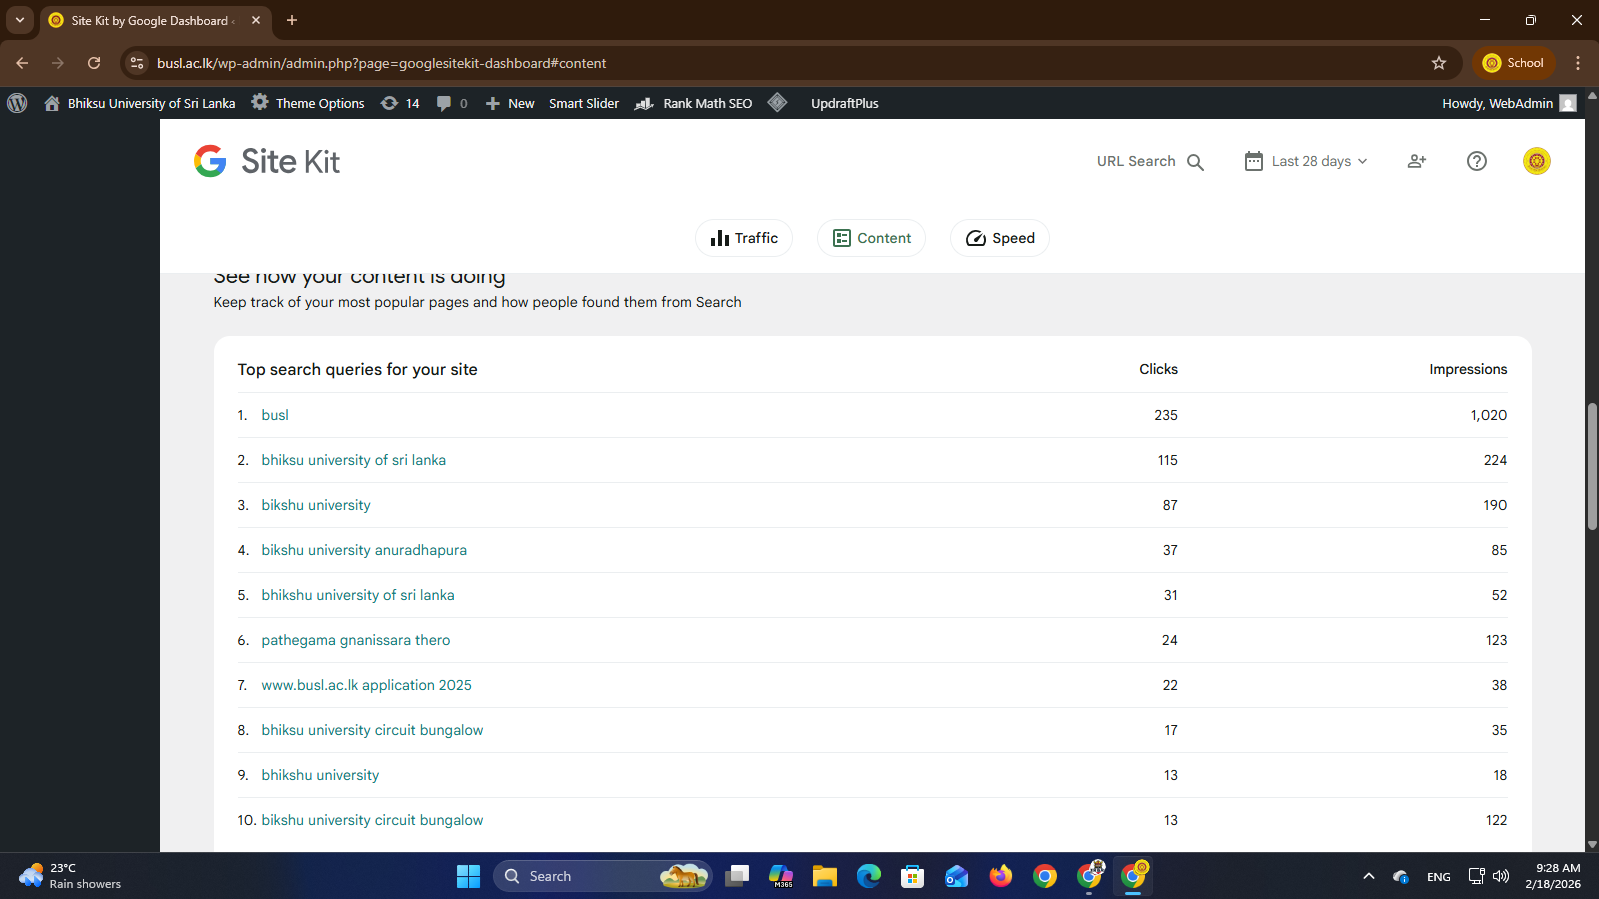
2️⃣ Search Performance (Google Search)
🔎 Search Traffic (Last 28 Days)
Total Impressions: 34,000
Total Clicks: 2,200
Unique Visitors from Search: 1,200
Click Growth: +694.5%
Visitor Growth: +670.5%
📌 This means your SEO efforts are working. The university website is appearing much more in search results.
3️⃣ Website Engagement
⏱ Average Engagement Time
1 minute 29 seconds per active user
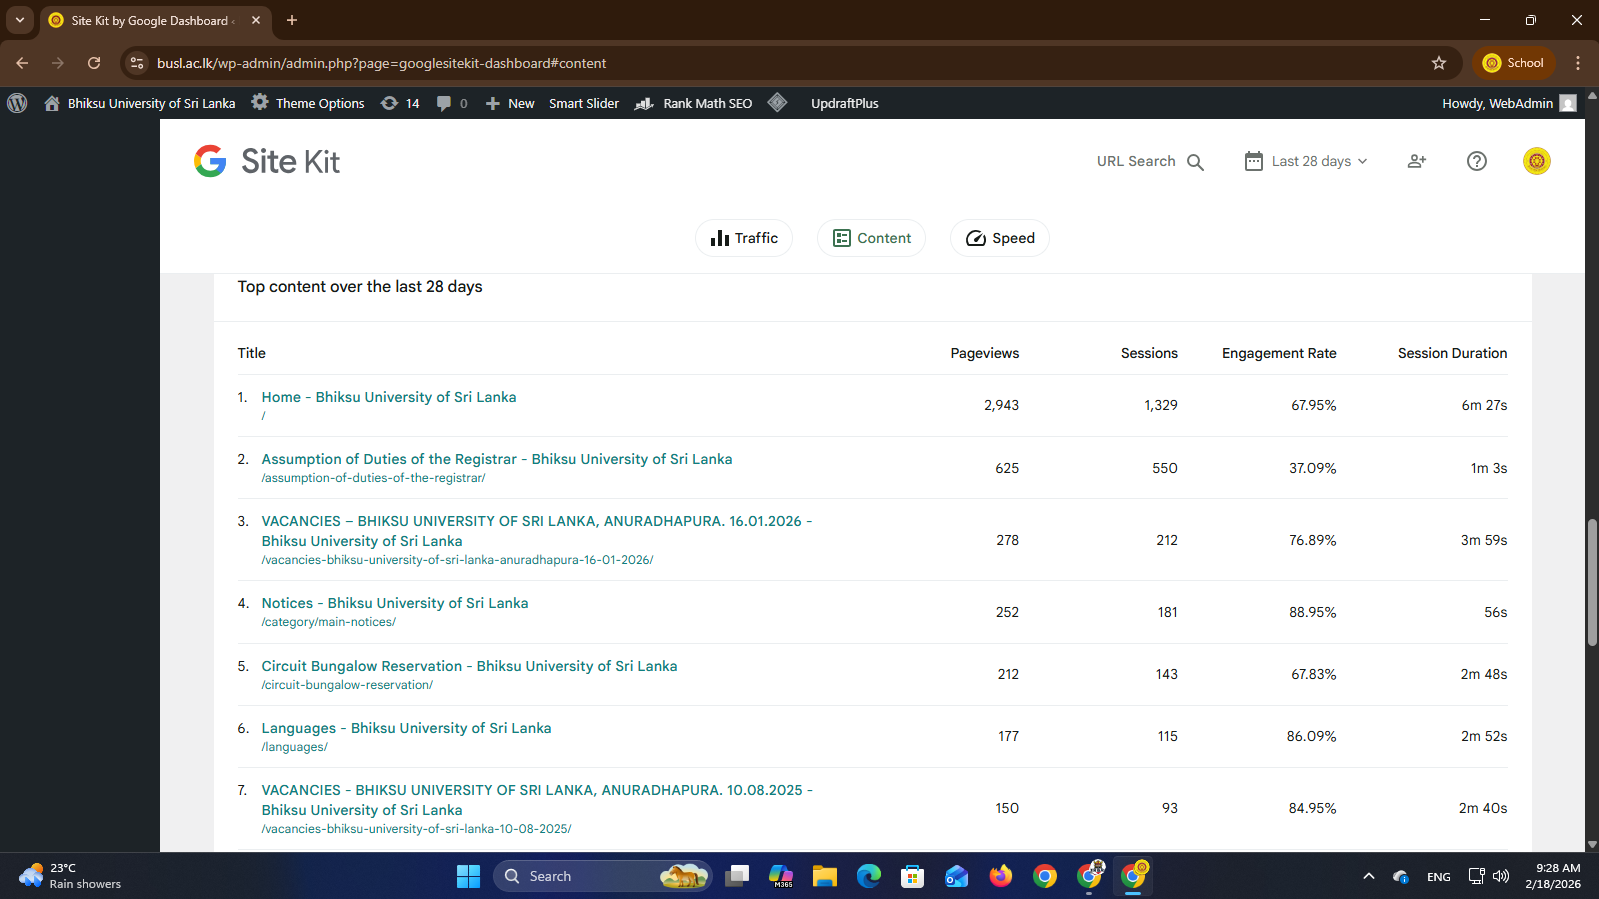
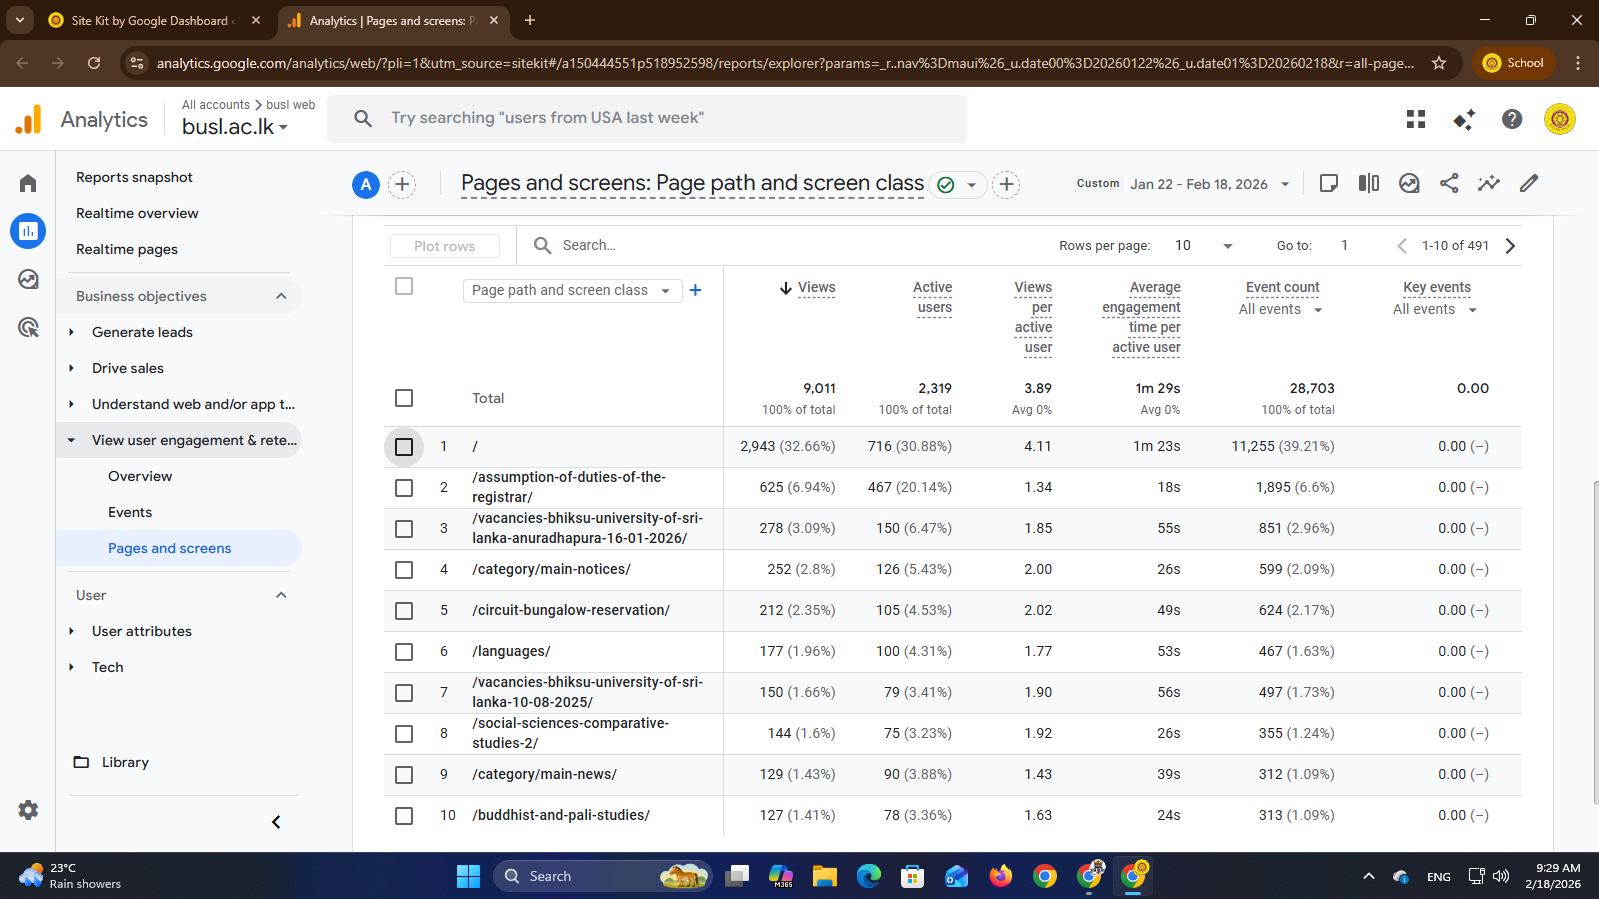
📄 Total Views
9,011 page views
28,703 total events
📌 Engagement is moderate. Some pages perform very well, while others need improvement.
| Rank | Page | Views | Engagement |
|---|---|---|---|
| 1 | Home Page (/) | 2,943 | 1m 23s |
| 2 | Assumption of Duties – Registrar | 625 | 18s |
| 3 | Vacancies (16.01.2026) | 278 | 55s |
| 4 | Main Notices | 252 | 26s |
| 5 | Circuit Bungalow Reservation | 212 | 49s |
5️⃣ Traffic Sources (Channels)
Organic Search: 49.4%
Direct Traffic: 41.4%
Unassigned: 4.4%
Organic Social + Others: Small percentage
📌 Almost 50% traffic from Google search – very positive for a university website.
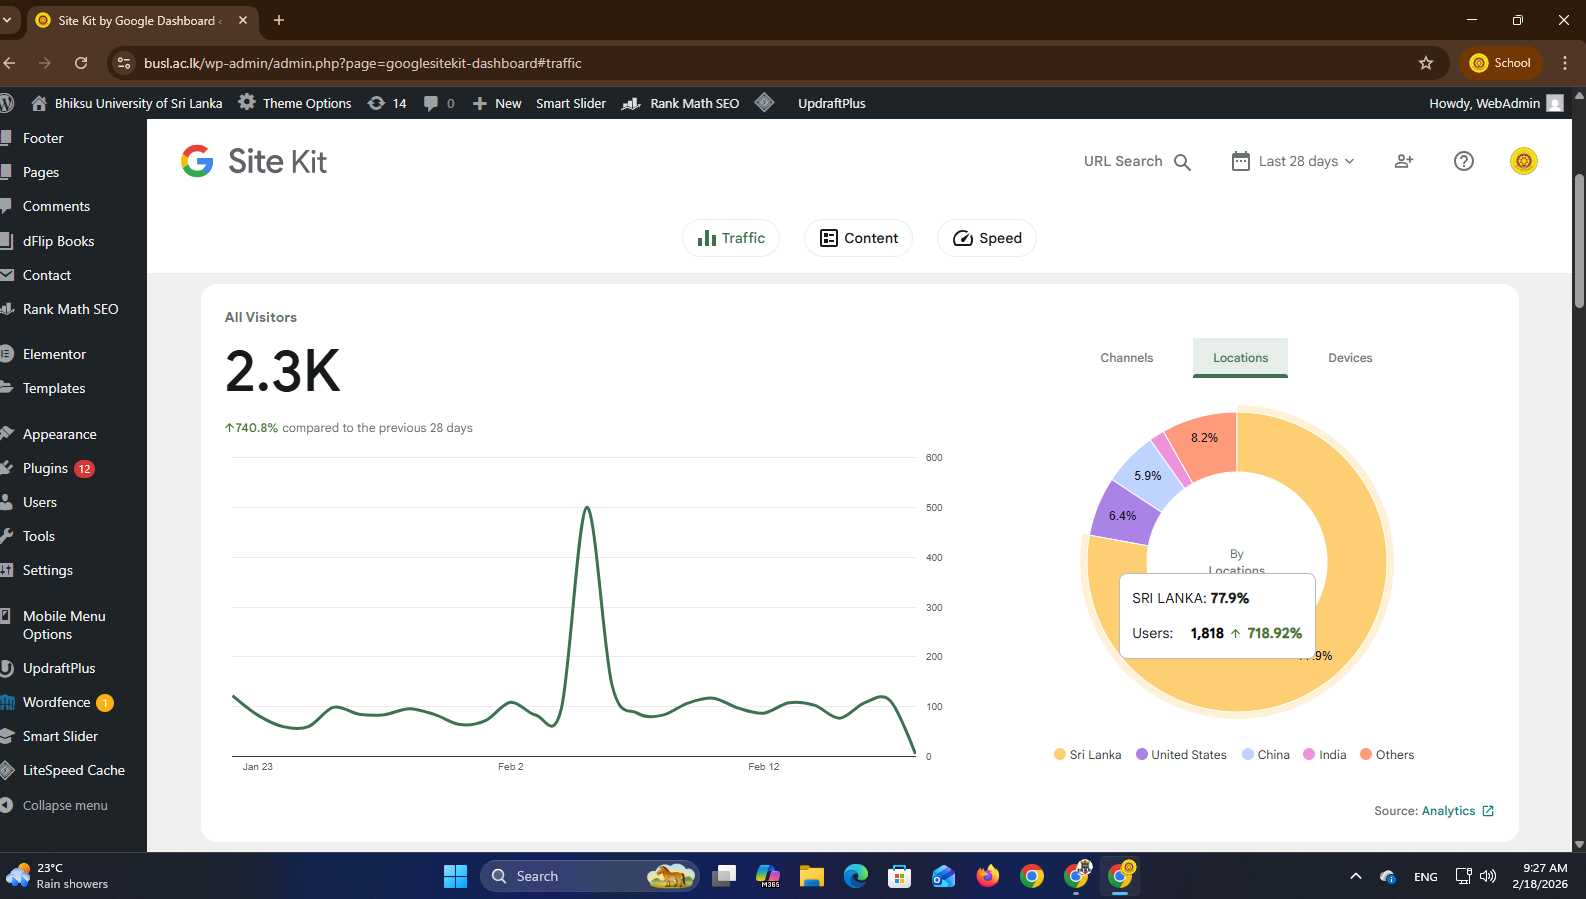
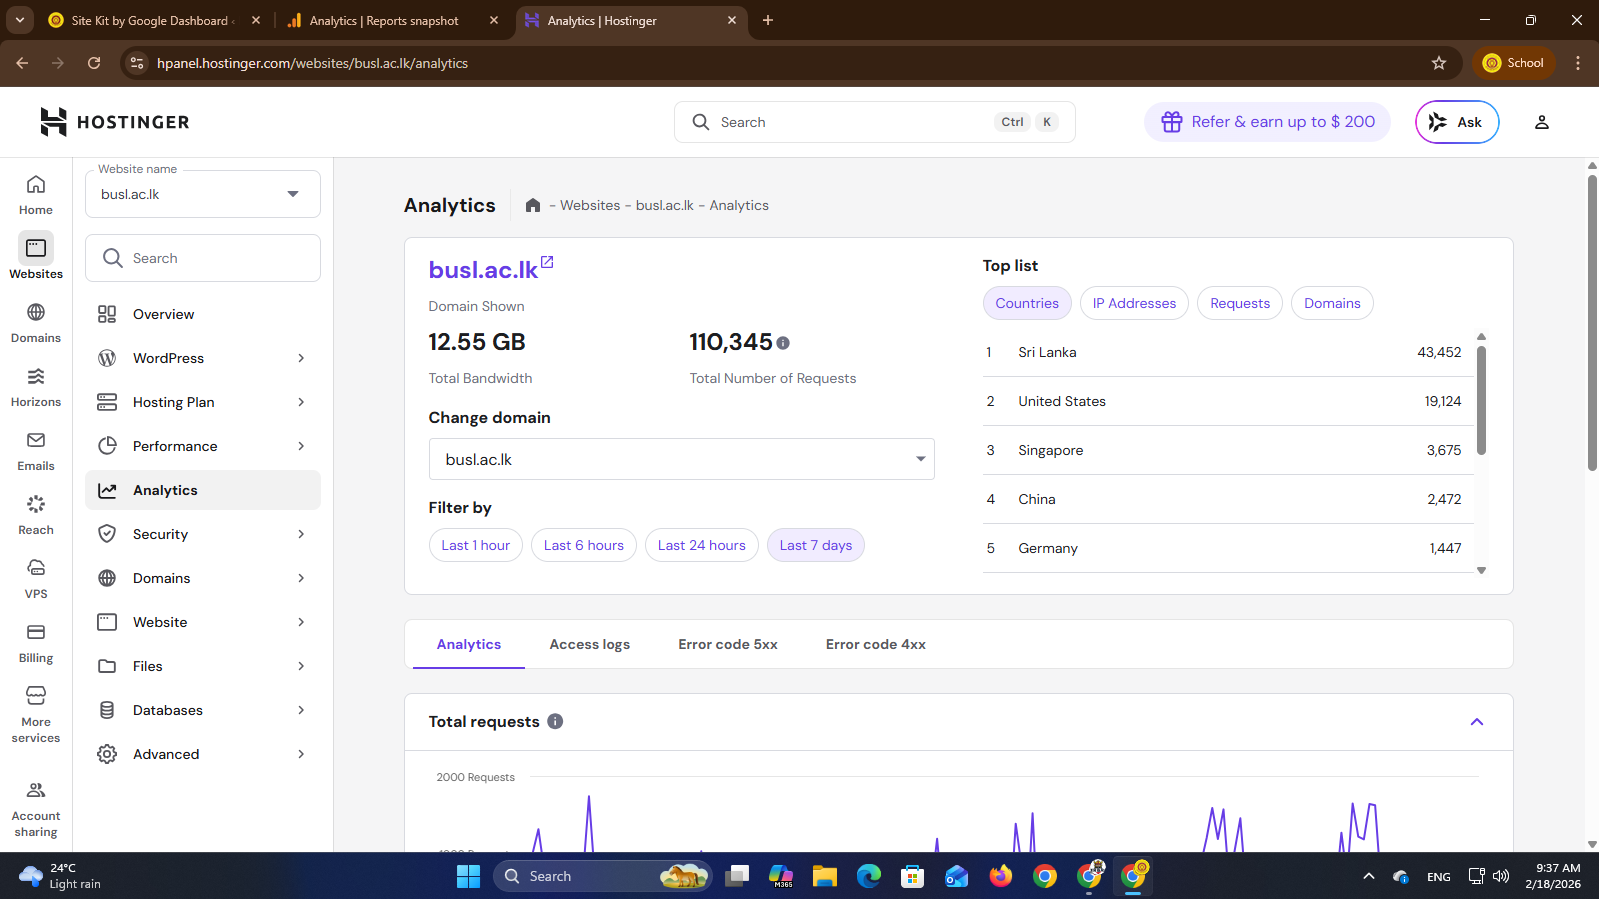
6️⃣ Geographic Distribution
🇱🇰 Sri Lanka: 77.9% (1,818 users)
🇺🇸 United States: 6.4%
🇨🇳 China: 5.9%
🇮🇳 India: 8.2%
Others: Small %
📌 Mostly local traffic, but some international visibility is growing.
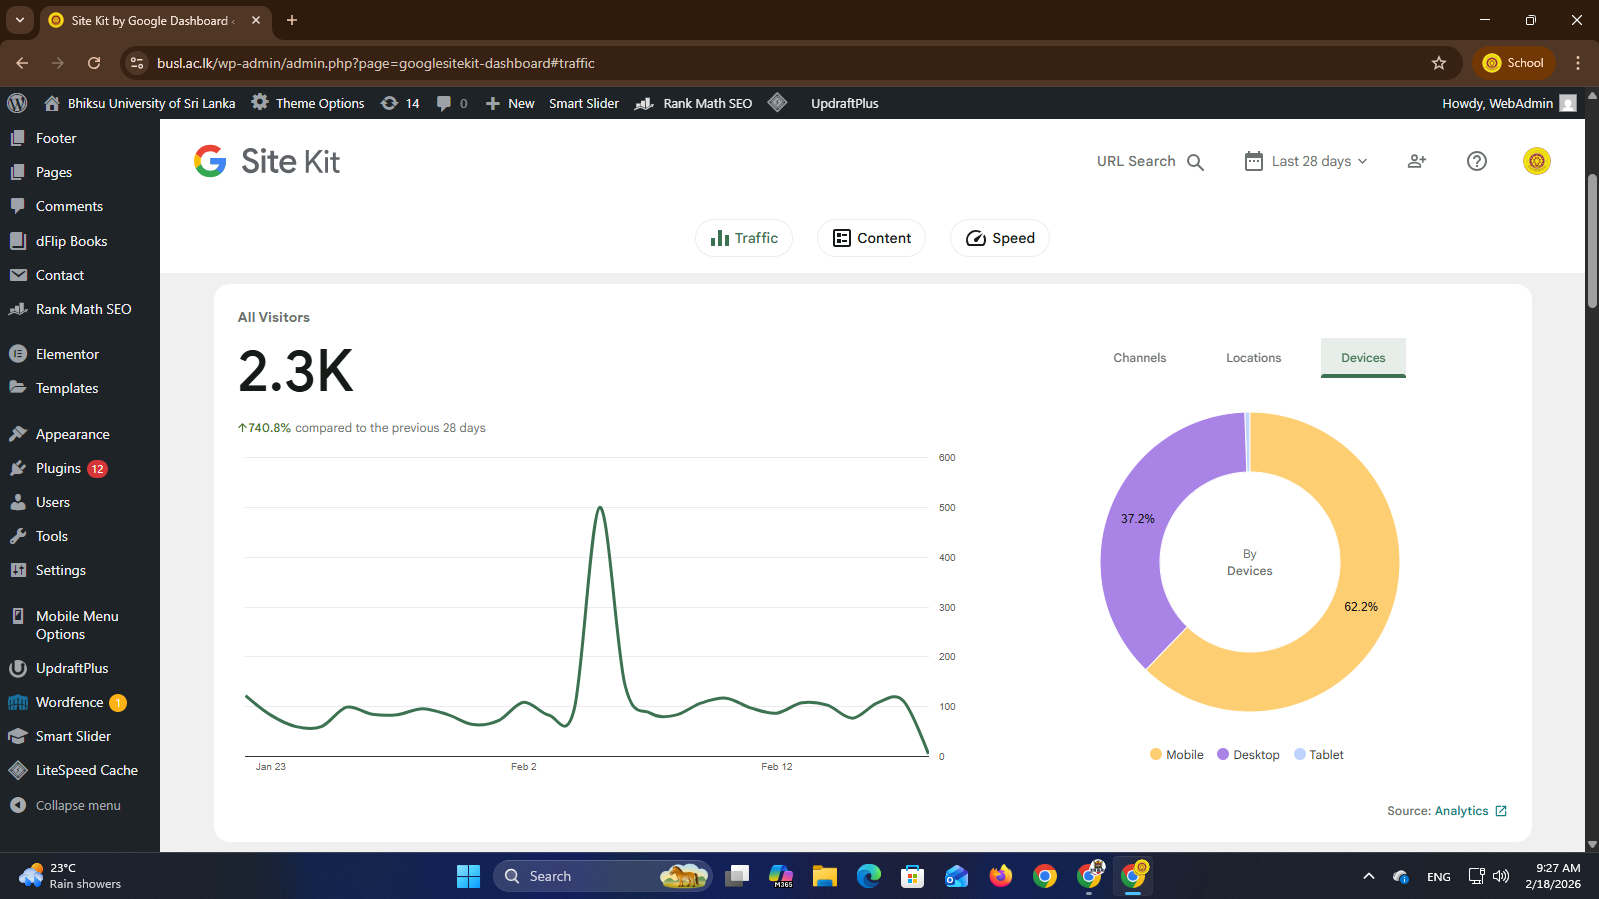
7️⃣ Device Usage
📱 Mobile: 62.2%
💻 Desktop: 37.2%
📱 Tablet: Very small %
⚠️ Important: Your website must be fully optimized for mobile users. Most visitors are on phones.
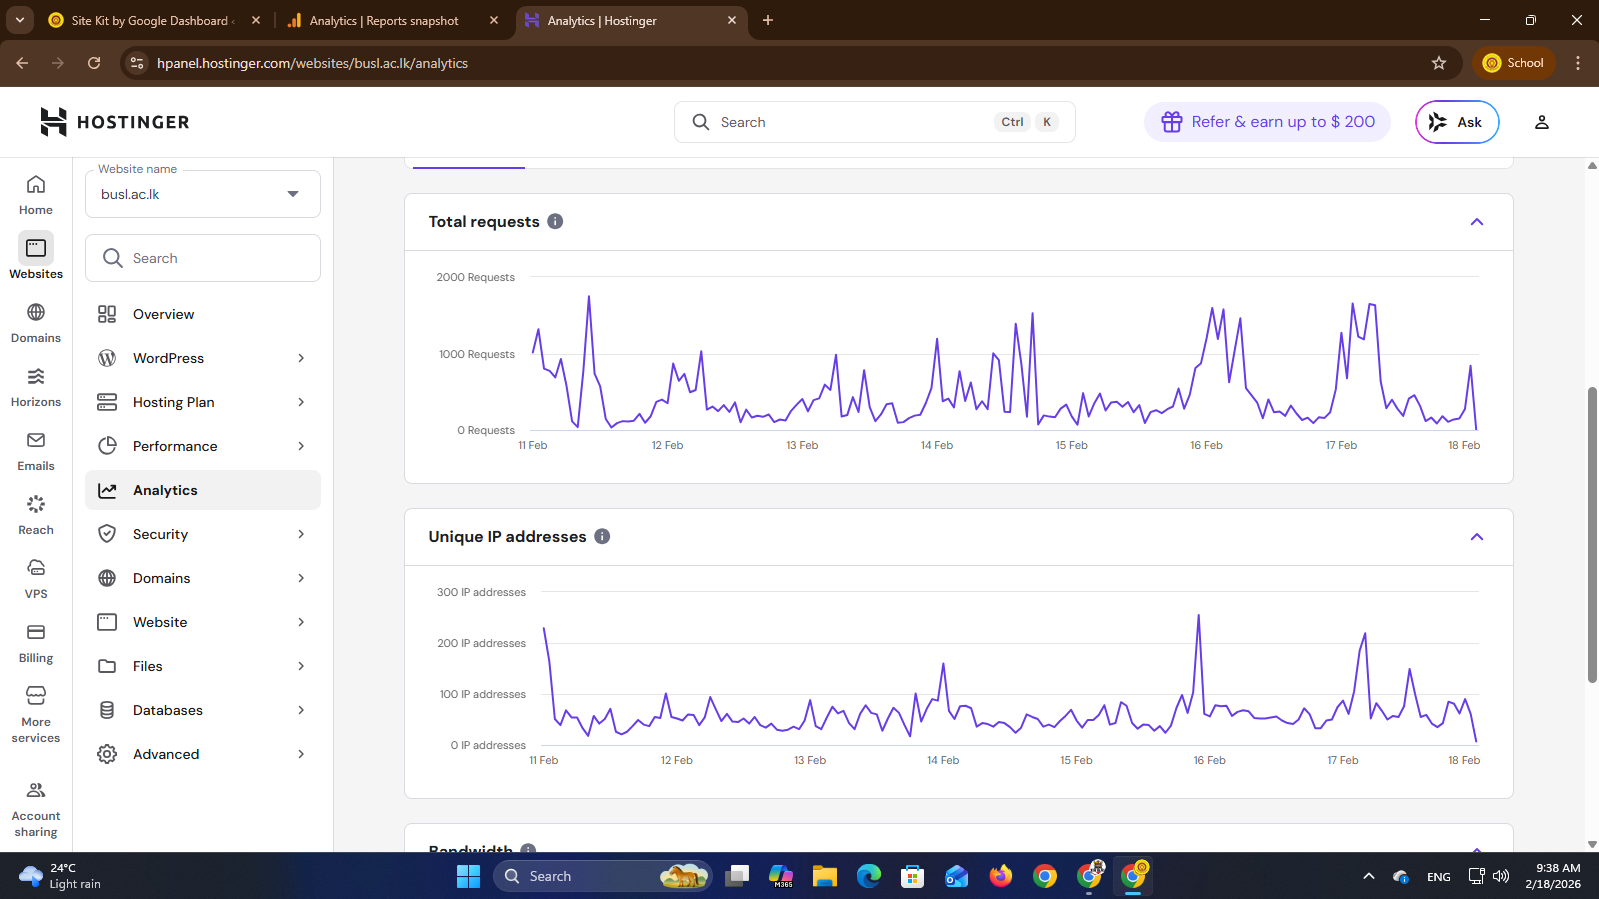
8️⃣ Hosting Server Analytics (Hostinger)
Total Bandwidth Used: 12.55 GB
Total Requests: 110,345
Traffic Peaks: Around Feb 9 and Feb 16–17