 Period: Mar 18 to Apr 22
 Website: busl.ac.lk
 Source: Google Analytics (GA4) + Site Kit + Hostinger
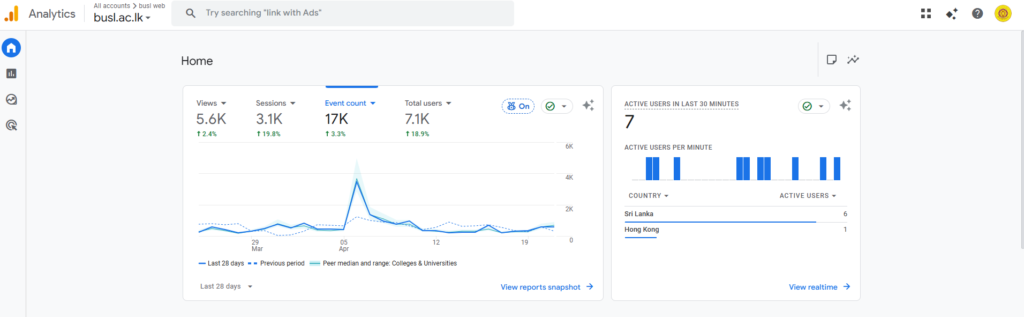
 Overall Traffic Performance
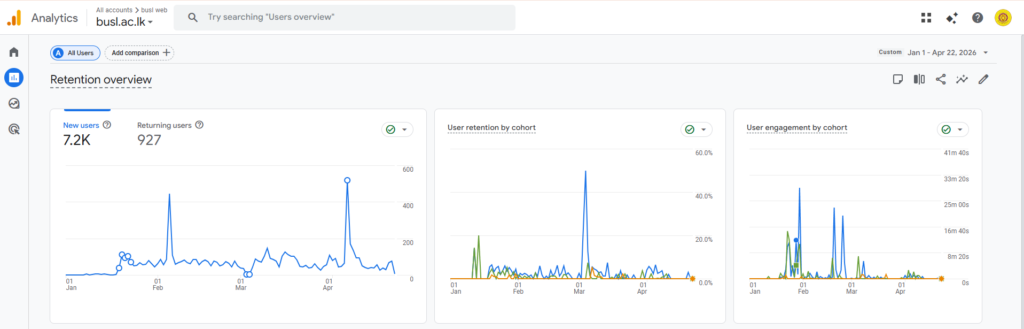
 Users & Visitors
Total Visitors (Site Kit): 7.1K
 Search Performance
 Website Engagement
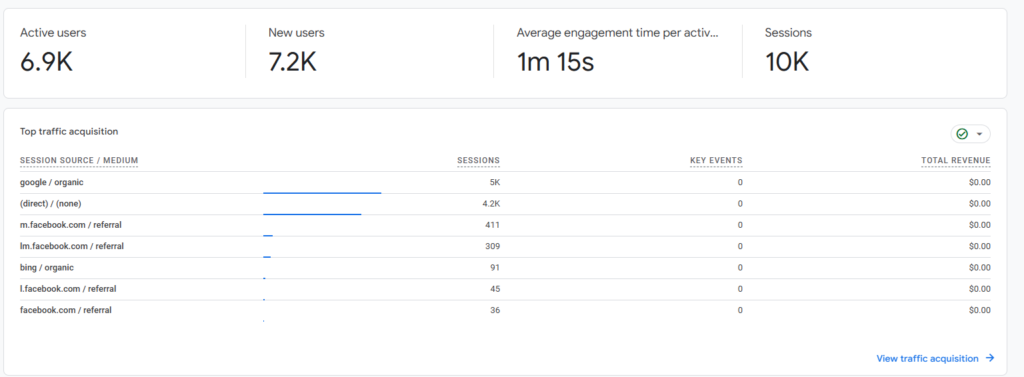
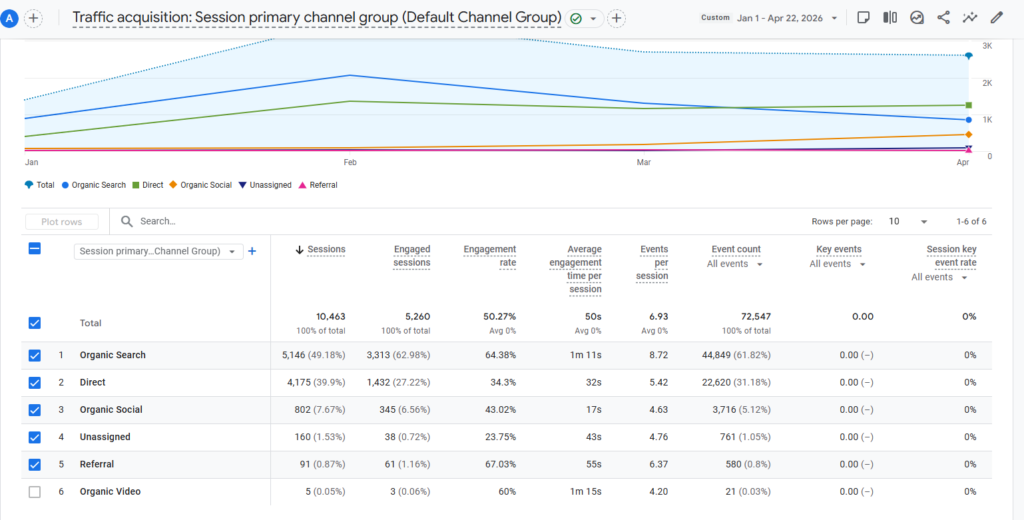
 Traffic Sources (Channels)
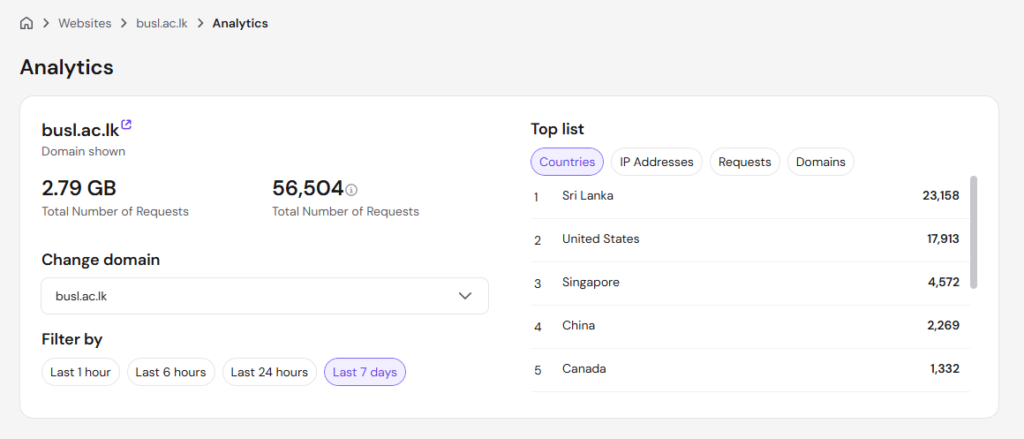
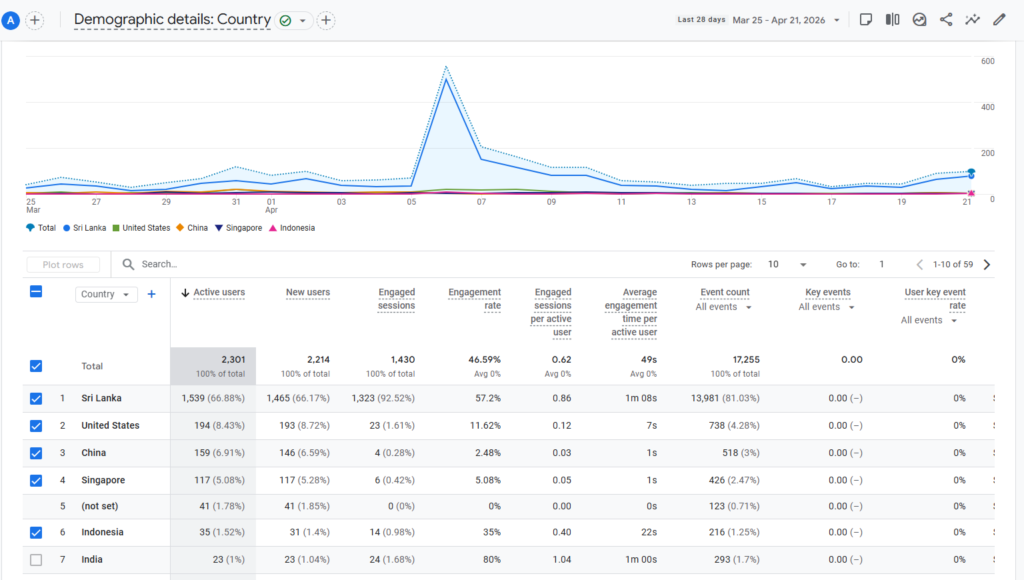
 Geographic Distribution
 Hosting Server Analytics (Hostinger)